
A Novel Approach to SITELLE Data Analysis Using Machine Learning Algorithms
Carter Rhea, Laurie Rousseau-Nepton, Simon Prunet, Julie Hlavacek-Larrondo, Sébastien Fabbro, Myriam Prasow-Émond, Natalia Vale-Asari, Kathryn Grasha, Laurence Perreault-Levasseur
A Brief Introduction
SITELLE & SIGNALS
SITELLE is an imaging Fourier Transform Spectrograph located at the CFHT. The instrument has an impressive 11x11 arcminute field-of-view. The spectral resolution can vary between 1 and 10,000 depending on the observation.
SIGNALS (Star formation, Ionized Gas, and Nebular Abundances Legacy Survey) is a large program using SITELLE lead by Dr. Laurie Rousseau-Nepton.
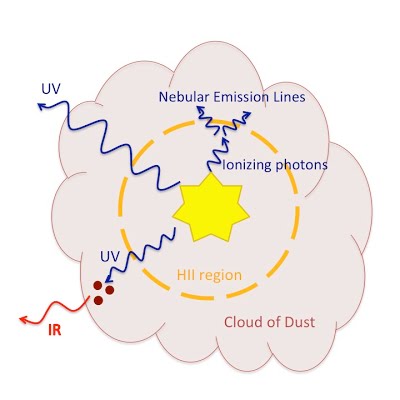
HII Regions
In a nutshell, HII regions are formed from gaseous clumps ionized by young, hot OB stars. Their emission is characterized by strong recombination or collisional emission lines and serve as tracers of different feedback mechanisms in the galaxy.
Why Machine Learning?
Standard fitting procedures require a priori estimates of kinematic parameters that are often unknown initially. Our solution is to use machine learning to estimate these variables
This work was initially inspired by Dr. Sébastien Fabbro's team's work on using machine learning to analyze stellar spectrum.
Our Projects
Click on the headers to learn more!
A crucial step in developing a machine learning algorithm is constructing the appropriate training set. In order to do so, we create synthetic SITELLE spectrum which represent SN1 (365-385), SN2 (480-520 nm), and SN3 (651-685 nm) emission from galaxies. We obtain line amplitudes from the 3 Million Mexican Model database simulations for HII regions (BOND simulation), planetary nebulae, and supernova remnants. We allow velocities to vary between -200 and 200 km/s and broadening to vary between 10 and 50 km/s. The emission lines are modeled as the SITELLE ILS, a sinc function, convolved with a Gaussian.

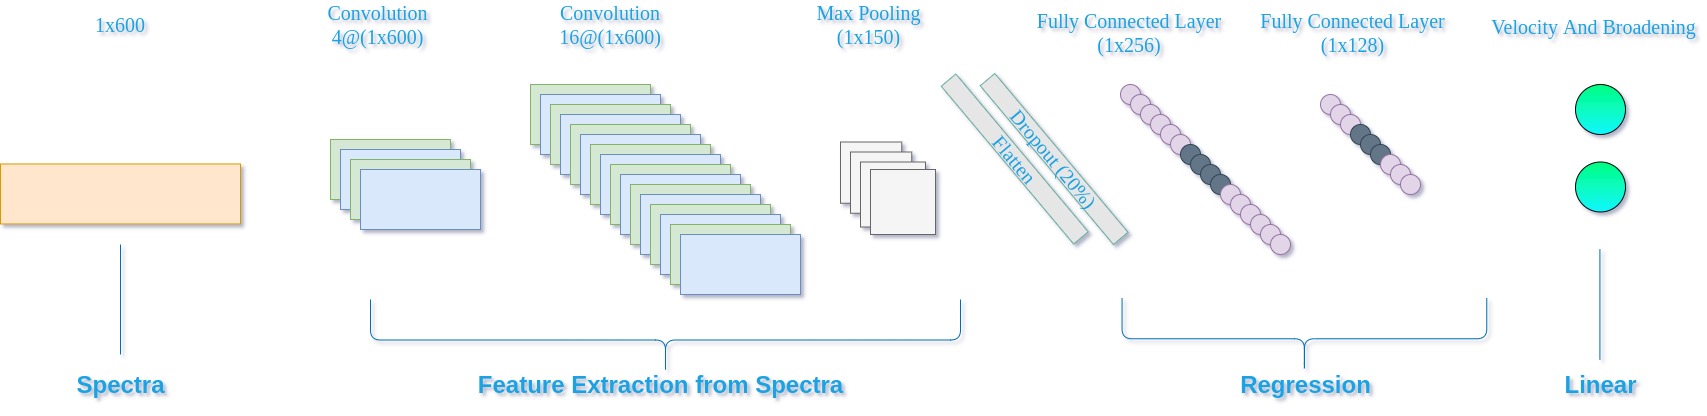
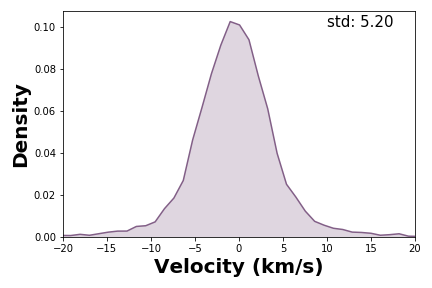
The first paper explores the use of a convolutional neural network to extract the flux and velocity of underlying components. We report a standard deviation of ∼5 km/s for the velocity parameter and a standard deviation of approximately 5.5 km/s for the broadening parameter.
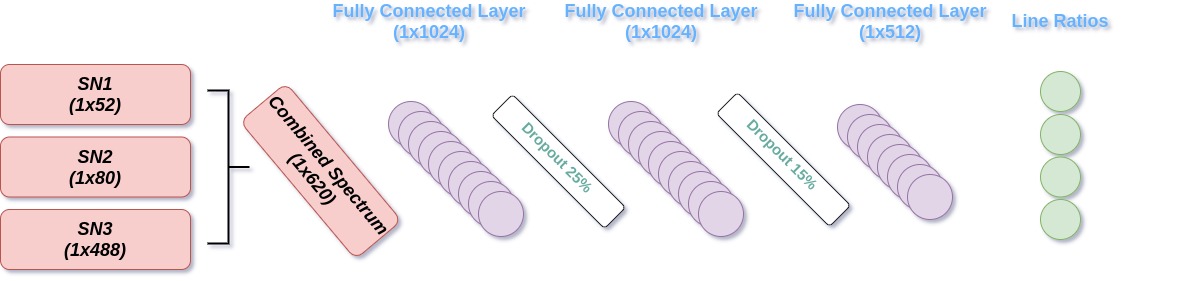
In this work, we apply an artificial neural network to combined-filter (SN1, SN2, and SN3) SITELLE data representing typical SIGNALS large program observations. The network is designed to calculate important emission-line ratios for HII-like regions which are present in the primary SITELLE filters. Our resultsindicate that the network can potentially constrain the line ratios with greater precision than the standard line fitting technique implemented in ORCS \textbf{if the source spectral properties are well represented in the training set}. Timing analysis indicates that the network can analyze the entire cube approximately 100 times faster than the standard methods.

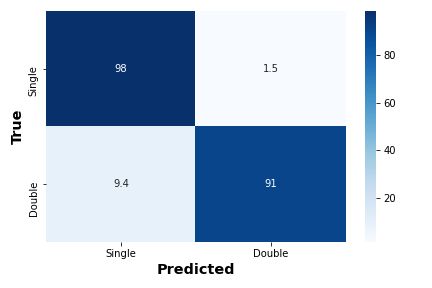
In this paper (in preparation), the third of the series, we develop a convolutional neural network to classify spectra as having either a sin-gle or double line-of-sight component. This systemati cmethod will be critical for disentangling components in merger systems, HII regions, and supernova remnants.We demonstrate that the network outperforms AIC andBayesian inference model comparisons.

Conclusions
We have demonstrated that machine learning is a viable method for emission line analysis . However, the training set must be developed with care. Moreover, we have shown that errors obtained using these methods are similar to those achieved with traditional methods Furthermore, machine learning algorithms are considerably less computationally expensive than traditional methods.
You can find more information about me on my website: crhea93.github.io
You can also email me at carter.rhea@umontreal.ca!
The code is freely available at https://github.com/sitelle-signals/Pamplemousse.