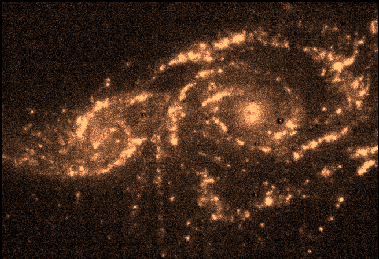
Example SNR Calculation
You can find the data used in this tutorial at the CADC database ([http://www.cadc-ccda.hia-iha.nrc-cnrc.gc.ca/en/search](http://www.cadc-ccda.hia-iha.nrc-cnrc.gc.ca/en/search)) searching for M33_FIELD7 SN1.
# Imports
import sys
sys.path.insert(0, '/media/carterrhea/carterrhea/SIGNALS/LUCI/')  # Location of Luci
from LuciBase import Luci
import LUCI.LuciPlotting as lplt
We now will set the required parameters. We are also going to be using our machine learning algorithm to get the initial guesses.
#Set Parameters
# Using Machine Learning Algorithm for Initial Guess
Luci_path = '/media/carterrhea/carterrhea/SIGNALS/LUCI/'
cube_dir = '/media/carterrhea/carterrhea/CFHT/Analysis-Paper3/NGC2207'  # Path to data cube
cube_name = 'IC2163_SN3.merged.cm1.1.0'  # don't add .hdf5 extension
object_name = 'NGC2207'
redshift = 0.009176  # Redshift of NGC 1275
resolution = 5000
We intialize our LUCI object
# Create Luci object
cube = Luci(Luci_path, cube_dir+'/'+cube_name, cube_dir, object_name, redshift, resolution, ML_bool)
The output will look something like this:
Create SNR Map
- We have two options to make the SNR map:
method=1 –> Calculate the signal as the peak flux in the spectrum
method=2 –> Calculate the signal as the total region under the spectrum taking into account only the regions around the NII doublet and Halpha emission lines
I strongly suggest using method 2 since it is more robust!
These SNR maps are perfect for future masking :)
cube.create_snr_map(x_min=450, x_max=1700, y_min=550, y_max=1500, method=2)