How to use LUCI Visualize
In this example we will go through how to use LUCI’s built in visualization tool. This example can be found as a python file in “LUCI/Examples/viewer.py”.
# Imports
import sys
import numpy as np
sys.path.insert(0, '/home/carterrhea/Documents/LUCI/')  # Location of Luci
from LuciBase import Luci
Inputs
We simply need to load our LUCI cube like usual :) So we start by defining the path, the name of the cube, the name of the object, the resolution (which isn’t actually used here), and the redshift.
Luci_path = '/home/carterrhea/Documents/LUCI/'
cube_dir = '/home/carterrhea/Documents/Luci_test'  # Path to data cube
cube_name = 'NGC6946_SN3'  # don't add .hdf5 extension
object_name = 'NGC6946'
redshift = 0.00068  # Redshift
resolution = 5000
Visualize!
We can now read in the cube and visualize the cube!
cube = Luci(Luci_path, cube_dir+'/'+cube_name, cube_dir, object_name, redshift, resolution, mdn=True)
cube.visualize()
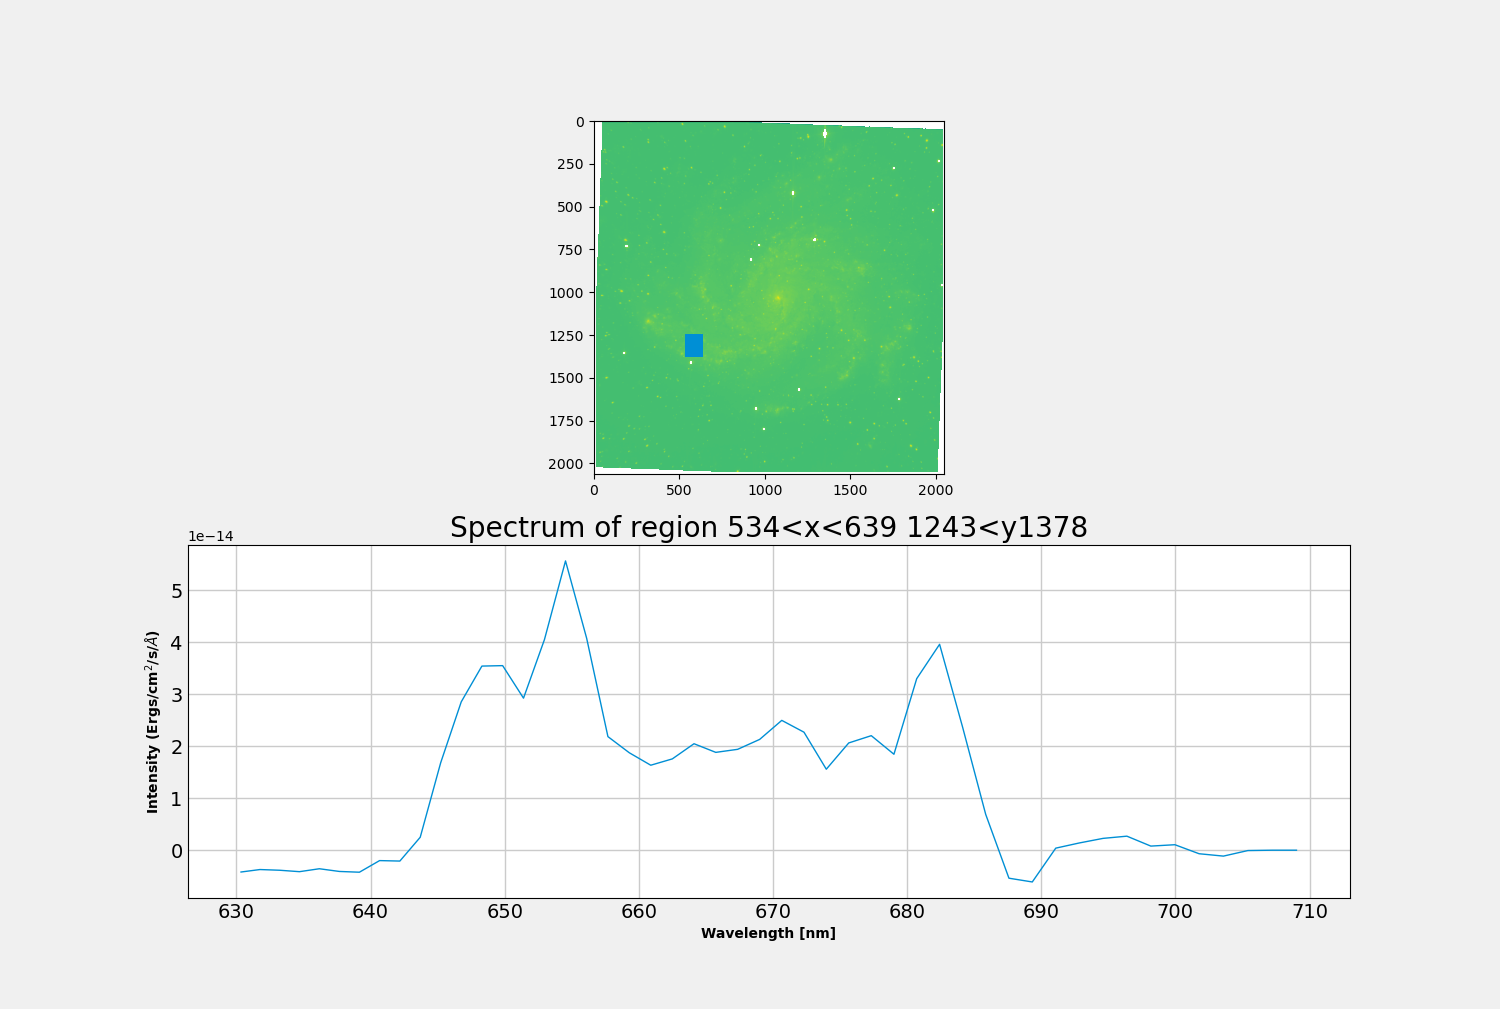
If you use our normal example, you’ll see something like this.
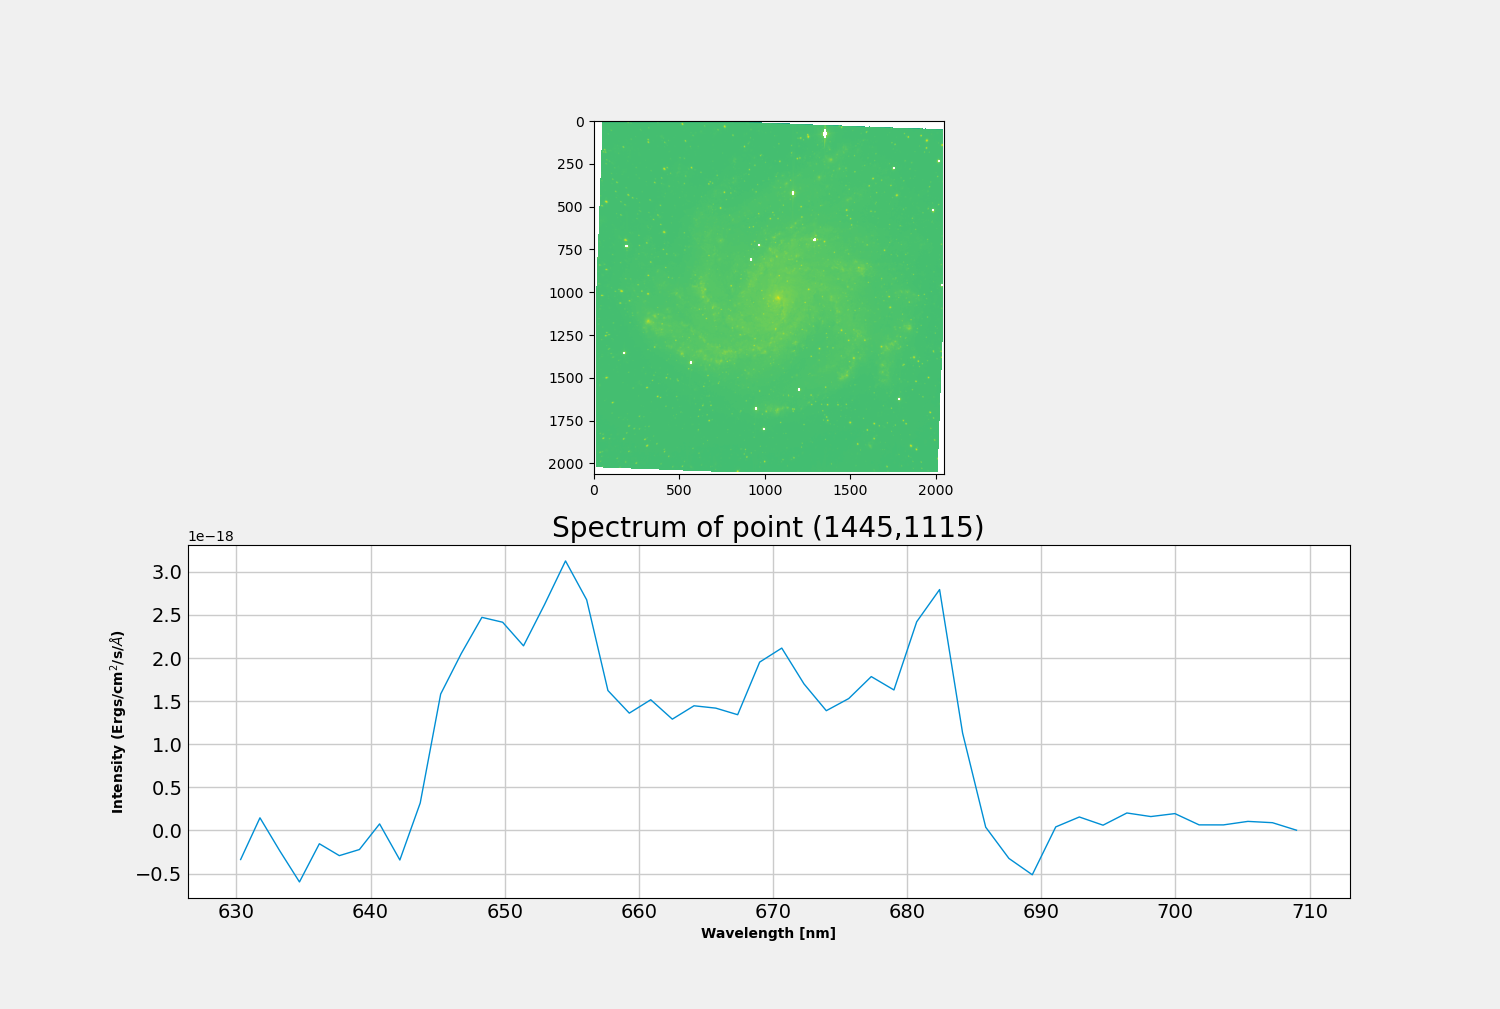
On the top panel we have our deep image scaled logarithmically. Once we select a region, the spectrum will be displayed in the bottom panel.
By clicking on a pixel you can plot the spectrum as such:
Or you can click and drag to create a rectangular region.